written on 05/07/2019
How to debug JavaScript applications and tests
In the business world, there are a lot of legacy JavaScript applications. Although client-side applications are the normal use-case in JavaScript, in recent years more and more Node.js applications were being built.
The problem we are having here is that applications are built quite complex and because of that they are hard to debug. Who has not worked on this monster legacy monolithic main application which was the core of the company written in Node.js? Express, Sequelize, Middlewares everywhere and spaghetti code. Drop in some MongoDB, do nasty stuff here and there and you know your enterprise project environment.
Testing these things is quite hard because of the many abstractions and side effects they could have. So writing the test is the first step to understand the behavior of the code but actually understanding the behavior of the code and what it is supposed to do is the initial step. Most often businesses write documentation about how to do things but you know, there are always too clever engineers doing hacky abstractions over abstractions just to reach this goal so the code is not really understandable by developers being new to the code.
Then it is nearly impossible that a new developer is writing a test because he/she might not understand the business case but even worse, he/she might not even understand what the code is doing. To understand this the developer will write a debugging statement. In JavaScript this normally looks like:
1console.log('I am finally here' + variable);
So what we get here is visual feedback in the command line. The command line is more or less the UI for the debugging code here. But actually, command lines were never made for debugging. Besides, this kind of debugging works for easy code snippets without a lot of side effects but when you get into complex if-else structures or into code with a lot of side effects and conditionals which you do not want to debug all the time (imagine if state x and y occurs then show me the result) then this kind of technique can be quite nasty.
JavaScript, in general, provides a solution for this. It is the debugger keyword. It is basically a keyword to set a breakpoint in your program. A breakpoint is a step where your application code will stop to run so you can inspect it. This is similar to a video playing of a procedure and you just stop the video during the play to inspect different things around the action happening in this specific video. You can find more resources about the debugger statement here:
An important quote of the official ECMAScript doc is the following:
[…] If a debugger is not present or active this statement has no observable effect.
This is the case when you run your application with node index.js . It is more or less the production environment a Node.js runs in and because Node.js is clever, it is not attaching a debugger to the application. This is mainly caused by performance gains. Running a debugger is always a performance hit for applications because the application has to have some binding to the debugger to enable features like variable watching, stack trace framing or breakpoints. This is, of course, a heavy operation and makes your application slower.
To enable the debugger when running your Node.js application you just have to start it with the --inspect parameter. This will expose an endpoint of your Node.js application on 127.0.01:9229. The endpoint is basically implementing a debugger specification. There are different debuggers out there like node-inspect, Chrome dev tools and many more which you can also find here: https://nodejs.org/de/docs/guides/debugging-getting-started/. Attaching the debugger is mostly a manual process at least once and can get quite tricky for some applications which are structured in a bad way. This is also a reason why you nearly see no one actually using a debugger 🤷 The setup is just too hard for just a bit of debugging so most people prefer to use a simple console.log instead of attaching the debugger. In client-side applications, this might be different because Chrome and Firefox have their own developer tools which are capable of debugging and automatically connects to a website’s JavaScript code. But in Node.js applications, you have to run the application in another “mode”. But for these problems, there is a solution called ndb .
ndb is an improved debugging experience for Node.js, enabled by Chrome DevTools — Description of the GitHub repository of ndb
Using ndb is quite easy. The only thing you have to do is to install it and then run your Node.js application with ndb yarn start . ndb is recommended to be installed globally. You can do this by:
1# global install with npm:2npm install -g ndb34# alternatively, with yarn:5yarn global add ndb
Otherwise, you could also add ndb as devDependency and create a Node.js script command to start your application with ndb prefixed.
Till now we have just focussed on starting a full-blown Node.js application with the debugger or ndb attached, but ndb is getting quite powerful because you can attach it to basically every Node.js process. When testing your application for example you could use ndb yarn test which invokes your test commands. Since these tests are executed in a Node.js environment you will have full debugger options. An example project I prepared a simple Node.js application which can find here: igeligel/ndb-showcase - A project to showcase project to show how to debug Node.js applications easily
This project just exposes a module in the index.js file and exports a function called add which takes two arguments and add them together. The functionality is also covered by a test in the tests directory. What might look weird is that the debugger statements are still included in the JavaScript files. Never do this in production-grade code. It was just for showcasing. The package.json file in this project creates four scripts which a developer could run:
1{2// ...3"scripts": {4"start": "node cli.js",5"start:debug": "ndb node cli.js",6"test": "jest",7"test:debug": "ndb jest"8}9// ...10}
If you run start or start:debug it will run the "CLI" example and otherwise, you can use test or test:debug to run the tests. The only difference between a command and a command appended with the :debug suffix will run ndb with the normal command. When running these it will open a Chrome window of the Chrome Dev Tools. If you have breakpoints set with the debugger statement the application will actually stop at those statements. Examples can be seen in the following screenshots:
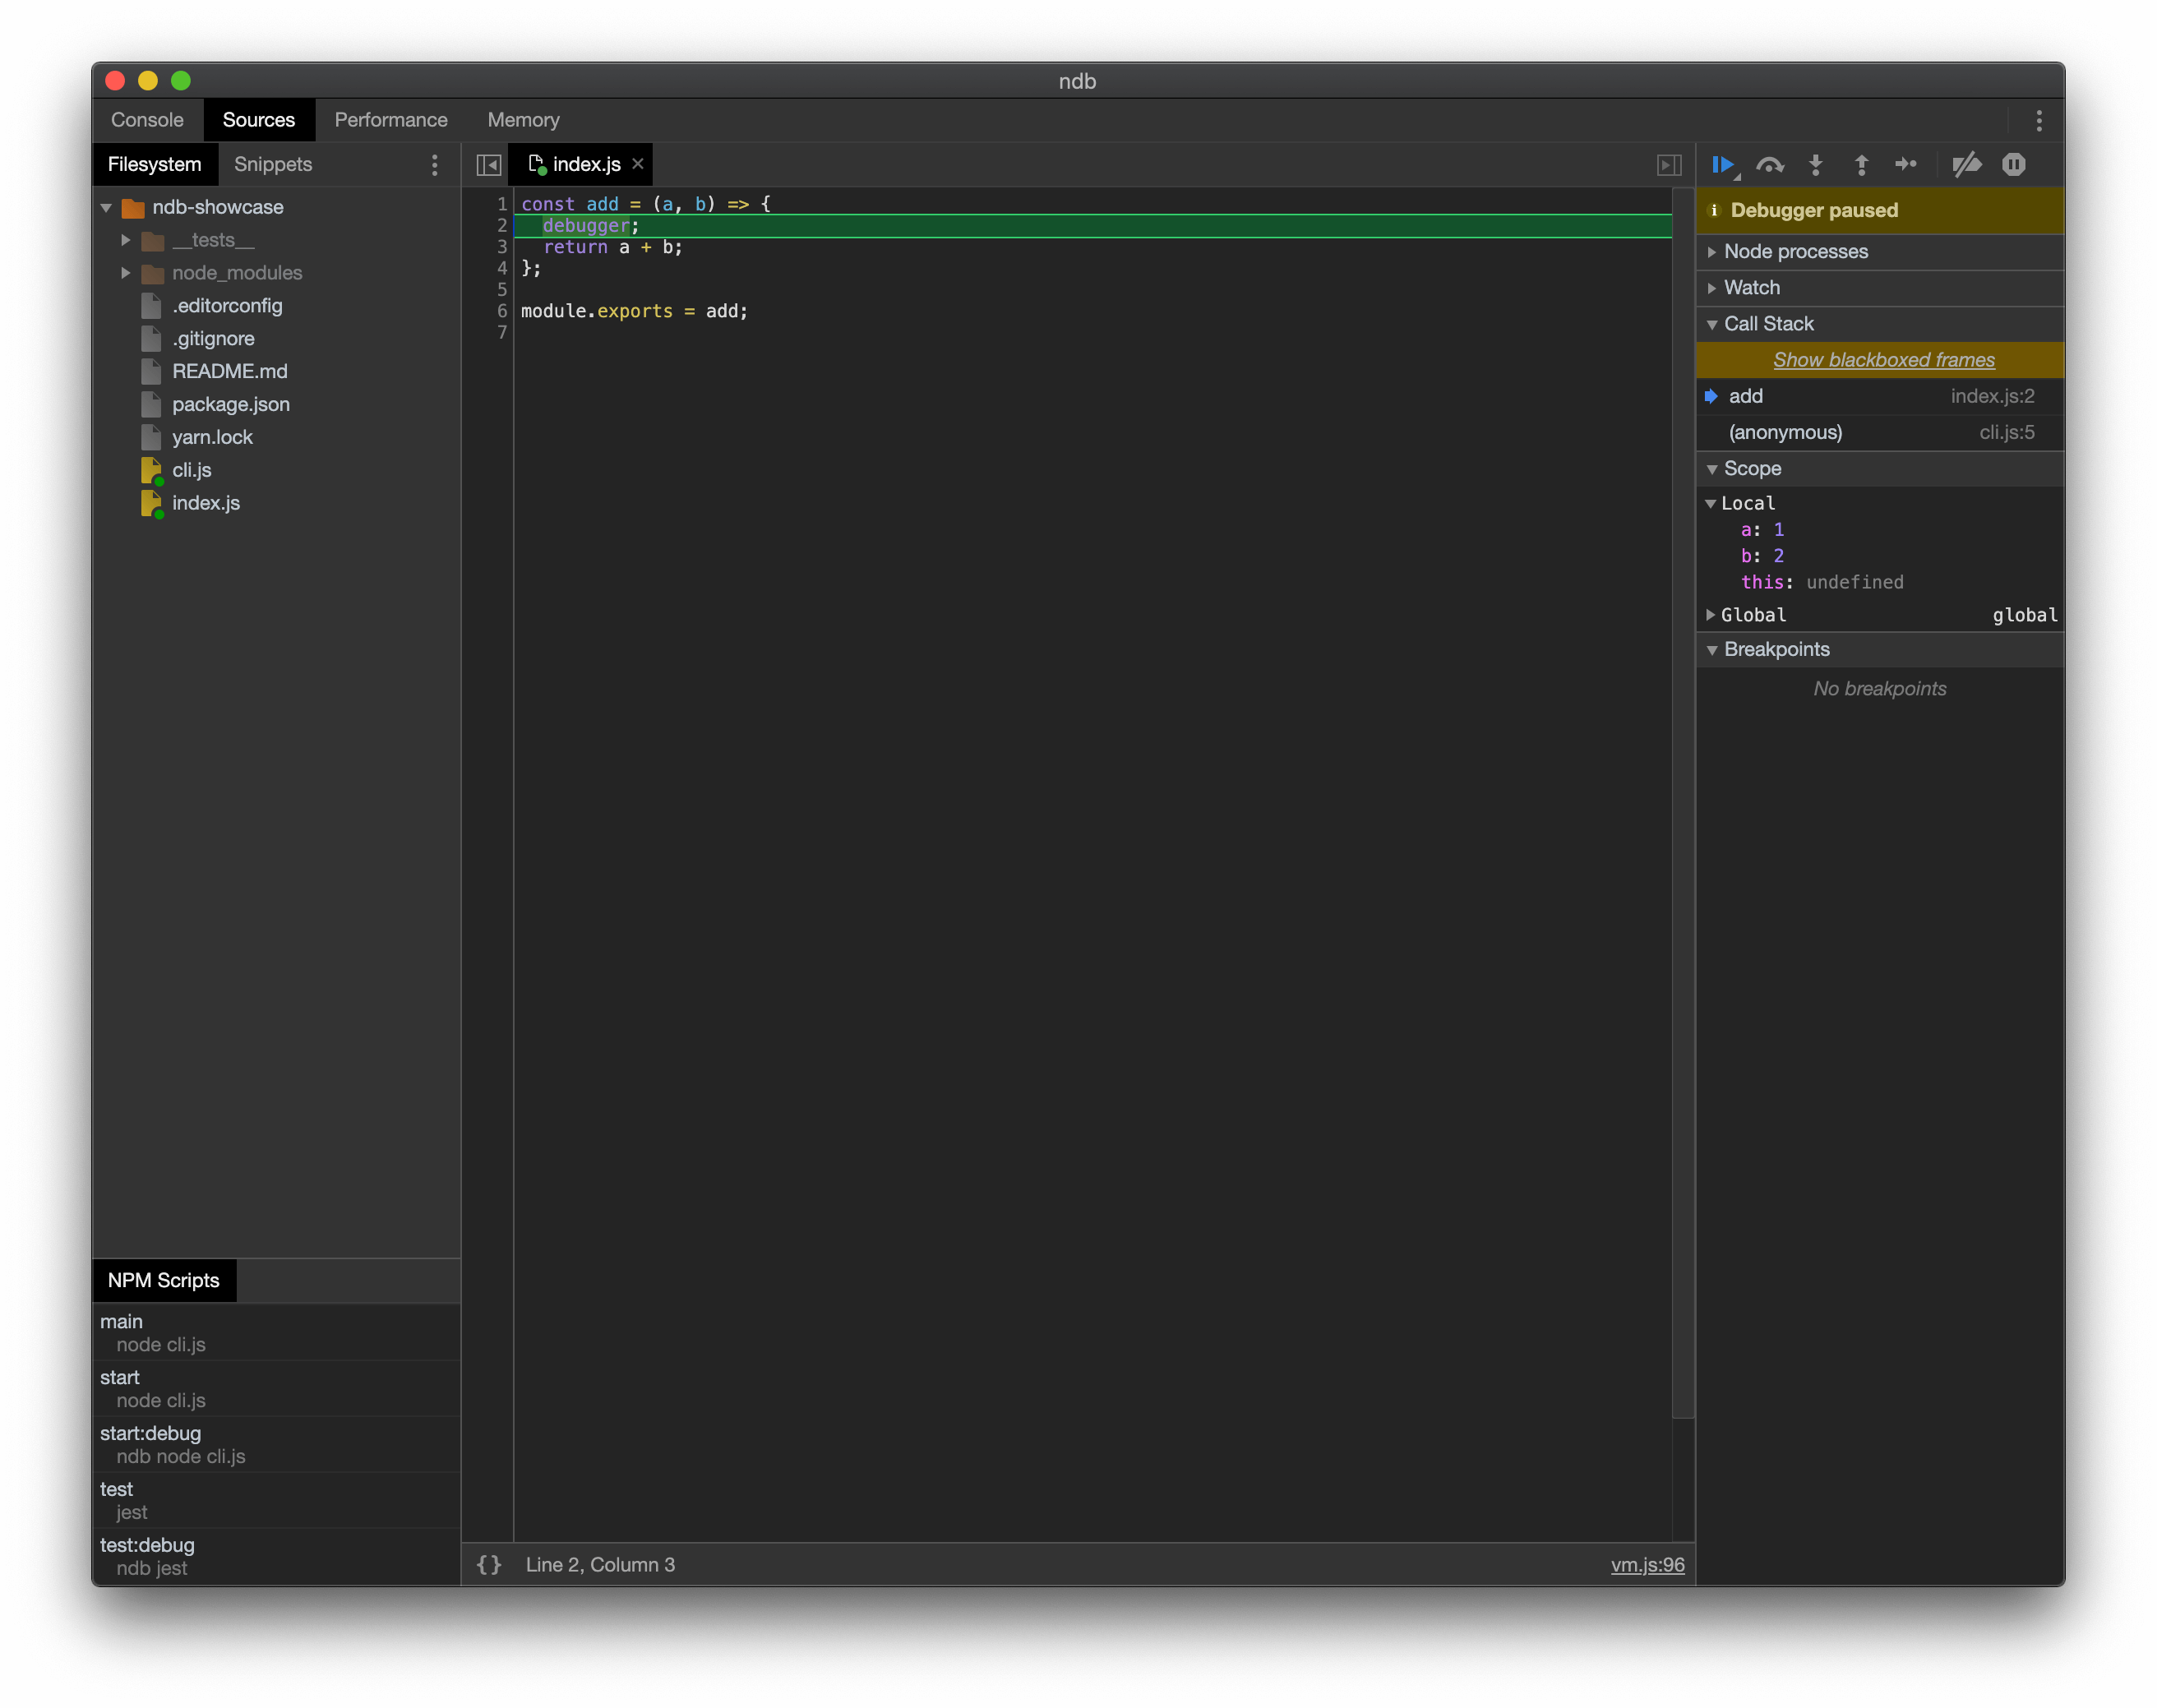
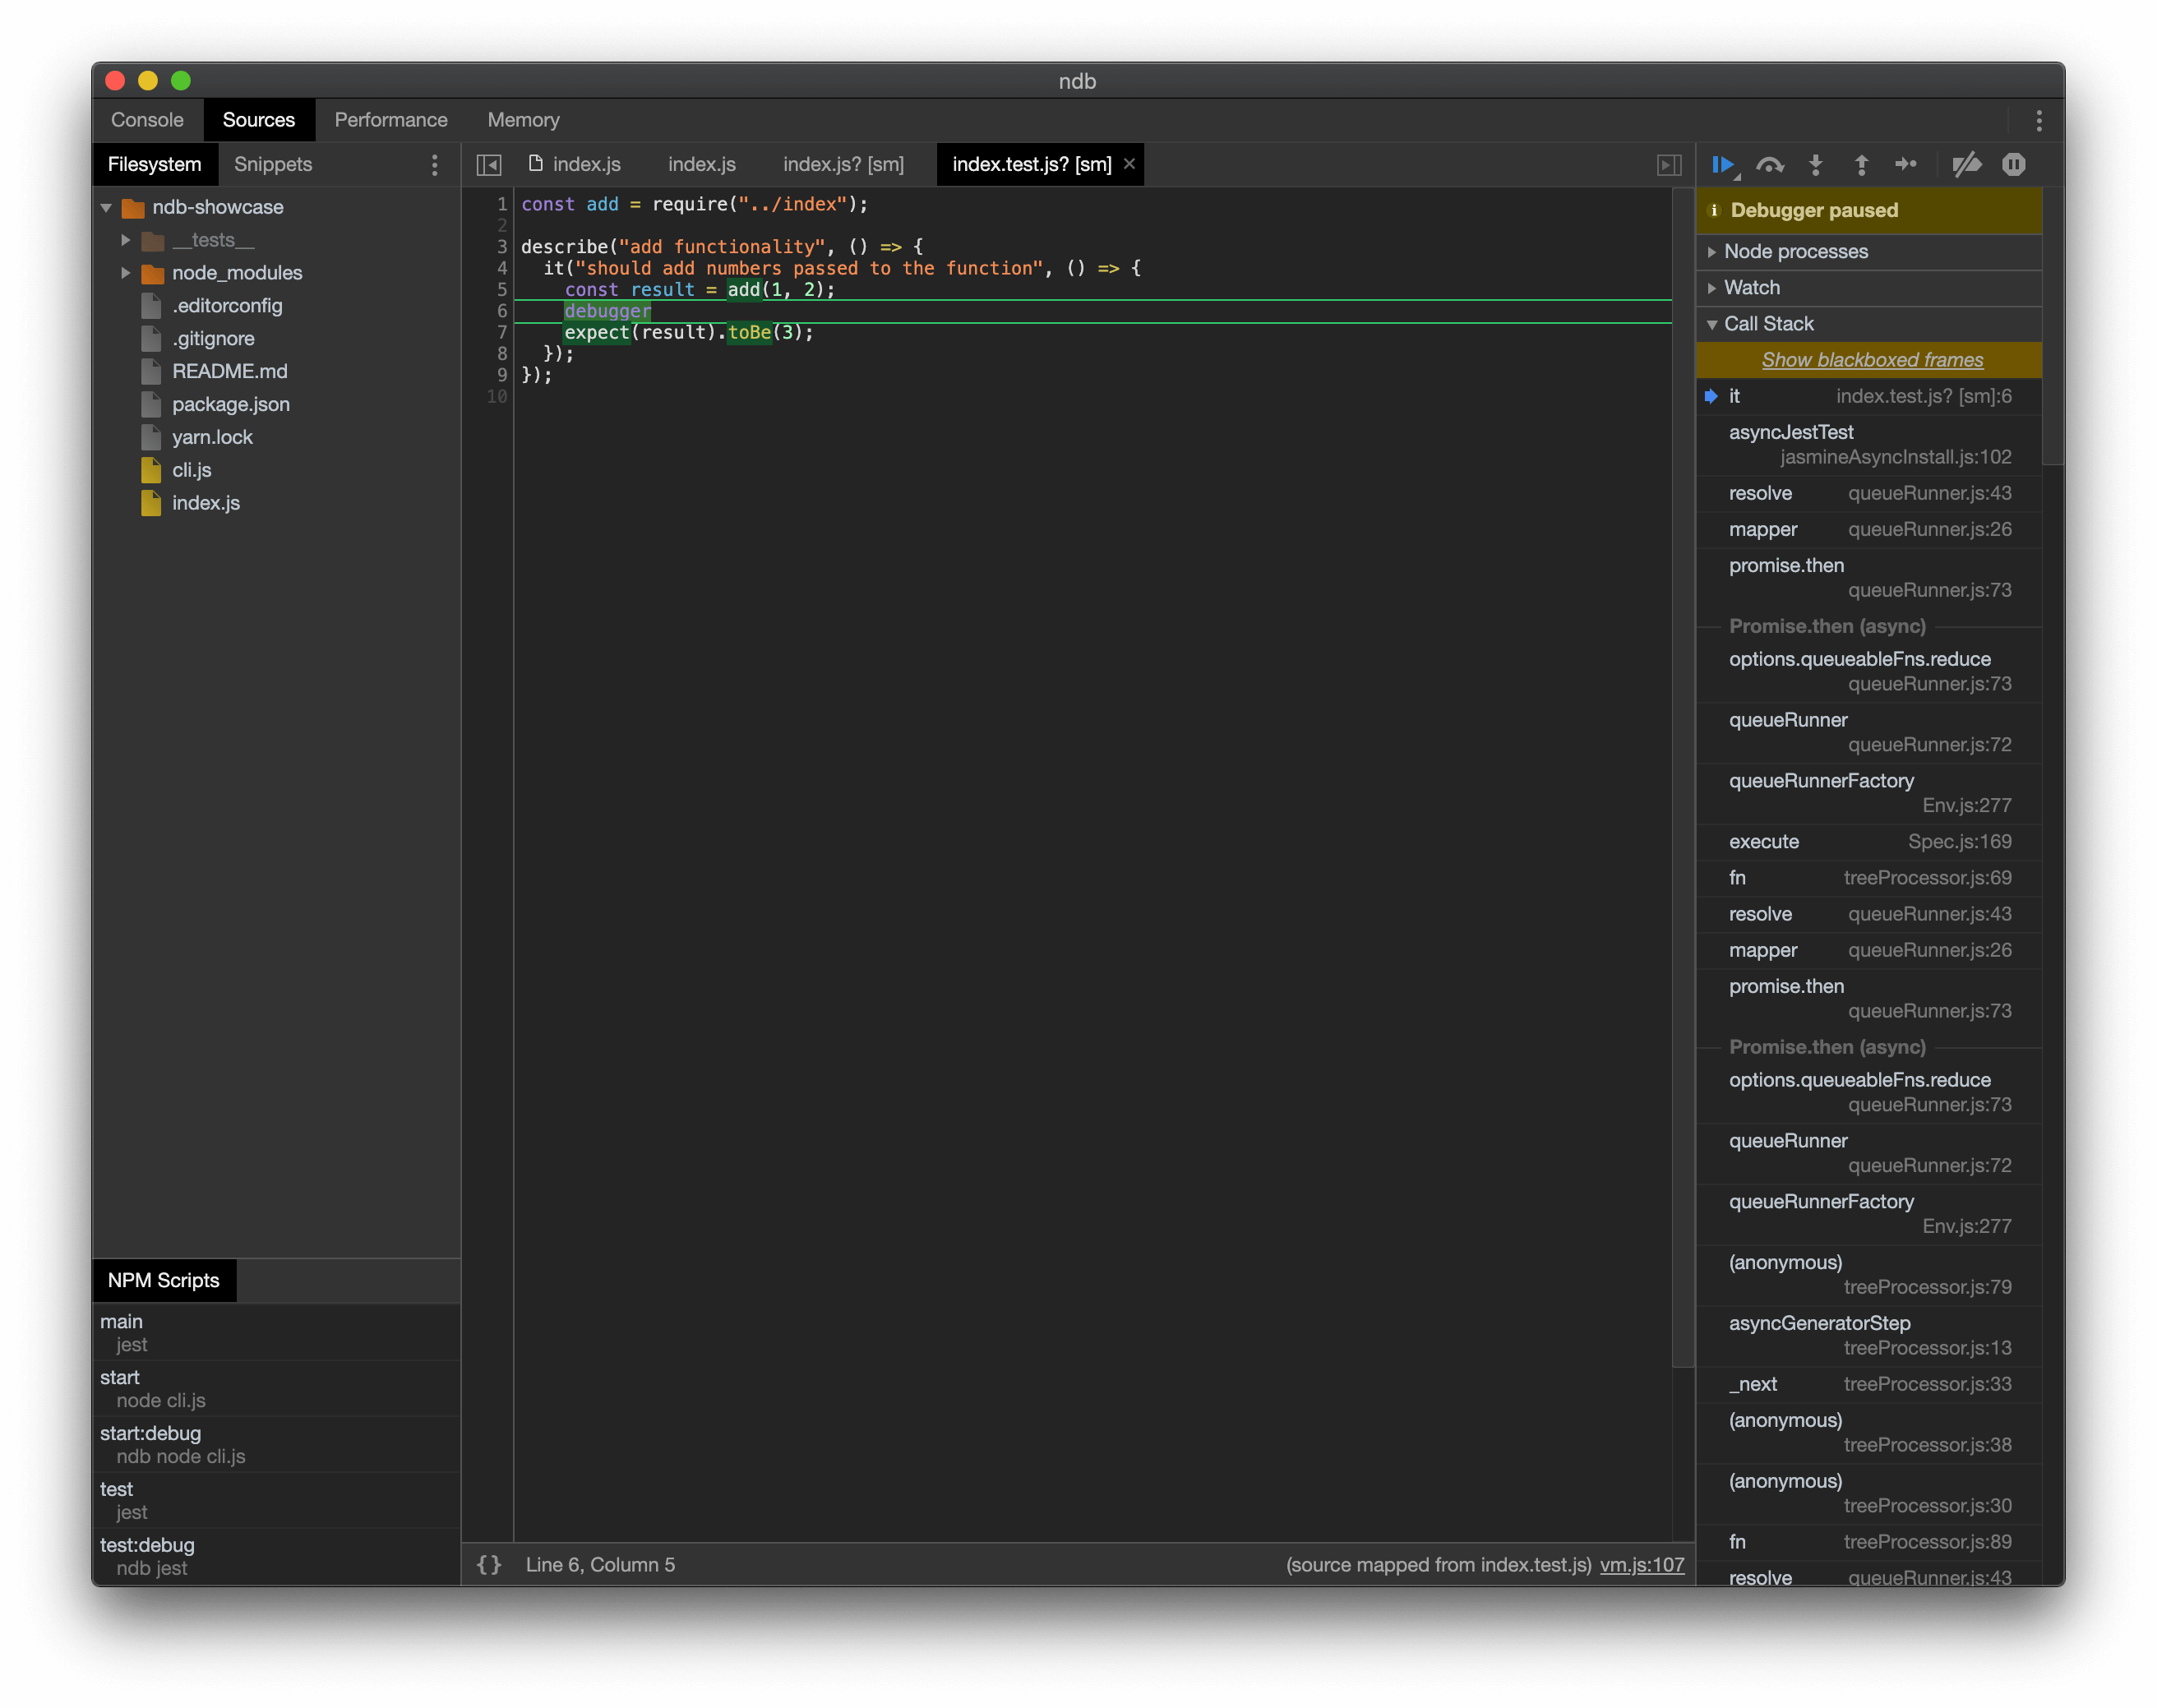
You can see that you have the normal Chrome Dev Tools functionalities without setting up a lot of boilerplate which makes ndb super awesome. It makes debugging for developers more accessible and reduces the barrier to actually use a proper debugger.
The most useful features here are probably the variable inspecting. You can just hover over variables and see the values without putting them into a console.log statement and even better, you can inspect maybe side-effected variables. Super awesome. There are a lot more capabilities which are for example shown in this video by the Chrome Developers Groups:
And that is how someone can easily debug a Node.js application. Please use ndb, show it to your coworkers and share this article.
Developers ❤️ debuggers Thanks for reading this. You rock 🤘 Also check my other blog articles like Function parameters in JavaScript, Learn how to refactor Vue.js Single File Components with a real-world example or Auto formatters for Python. If you have any feedback or want to add something to this article just comment here. You can also follow me on twitter or visit my personal site to stay up-to-date with my blog articles and many more things.
You might also like
Add or delete a property of an object in JavaScript
Ever struggled with adding or deleting a property in JavaScript? Check this article out to learn how omitting or adding properties works in ES5 and in ES6.
Auto formatters for Python
🔥Save time by using the best auto formatters for python - a comparison to find the best for Python 2 and Python 3